All problems are available on the Art of Problem Solving website at https://artofproblemsolving.com/community/c821645_2019_cca_math_bonanza.
The top 10 individuals (as announced at the competition) were (with ties broken by the Tiebreaker Round):
| Place | Team | Name | Score |
| 1 | Pacific Trails | Derek Liu | 12 |
| 2 | Apologies, San Diego | Andrew Gu | 11 |
| 3 | Torrey Pines 2 | Jeff Ren | 11 |
| 4 | Apologies, San Diego | Michael Diao | 11 |
| 5 | Bishop’s | Evan Ren | 10 |
| 6 | Del Norte | Justin Li | 10 |
| 7 | Torrey Pines 2 | Lucas Liu | 10 |
| 8 | Individuals 2 | Christine Yang | 10 |
| 9 | Torrey Pines 2 | Torrey Duan | 9 |
| 10 | Bishop’s | Tobey Shim | 9 |
Honorable mentions: Andrew Pu of Del Norte, Benjamin Hong of Individuals 2, Jerry Huang of Torrey Pines 1, Steven Zhang of Westview, and Sumith Nalabolu of Torrey Pines 1 (9).
The top 5 teams were
| Place | Team | Total | Indv Total (out of 60) | Team Round (50) | Lightning Round (40) |
| 1 | Apologies, San Diego | 114.40 | 37 | 45 | 32.40 |
| 2 | Torrey Pines 1 | 92.54 | 33 | 30 | 29.54 |
| 3 | Torrey Pines 2 | 89.45 | 36 | 35 | 18.45 |
| 4 | Bishop’s | 72.49 | 31 | 25 | 16.49 |
| 5 | Pacific Trails | 71.06 | 20 | 30 | 21.06 |
The top Coordination score was 1.53 by Eastlake 1. They submitted 40 when the IQR value (D value) was 36.5.
The best middle school team was Pacific Trails.
The most improved team was Del Norte.
The best new team was Calcaholics (San Dieguito Academy).
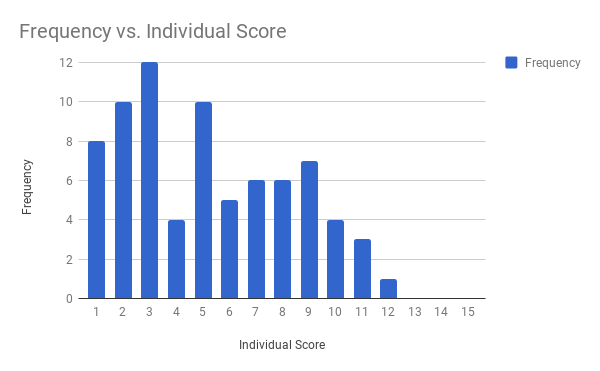
The score distribution for the Individual Round was:
| Score | Frequency |
| 15 | 0 |
| 14 | 0 |
| 13 | 0 |
| 12 | 1 |
| 11 | 3 |
| 10 | 4 |
| 9 | 7 |
| 8 | 6 |
| 7 | 6 |
| 6 | 5 |
| 5 | 10 |
| 4 | 4 |
| 3 | 12 |
| 2 | 10 |
| 1 | 8 |
| 0 | 4 |
The average score on the Individual Round was a 4.975. The median was a 5.
In histogram form:
Problem difficulty for the Individual Round was as follows:
| Problem | Number Solved |
Solve Percentage
|
| 1 | 60 | 75.00% |
| 2 | 50 | 62.50% |
| 3 | 47 | 58.75% |
| 4 | 31 | 38.75% |
| 5 | 41 | 51.25% |
| 6 | 55 | 68.75% |
| 7 | 24 | 30.00% |
| 8 | 27 | 33.75% |
| 9 | 31 | 38.75% |
| 10 | 10 | 12.50% |
| 11 | 15 | 18.75% |
| 12 | 1 | 1.25% |
| 13 | 5 | 6.25% |
| 14 | 1 | 1.25% |
| 15 | 0 | 0.00% |
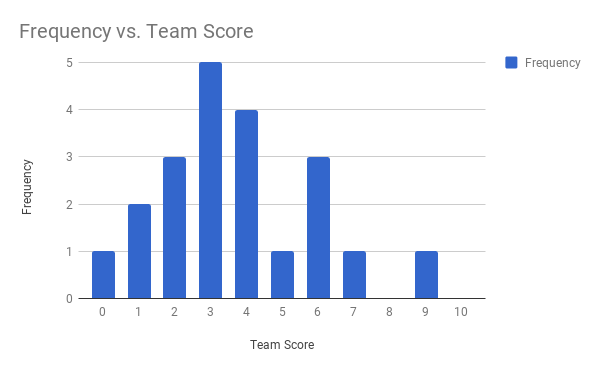
Score distribution for the Team Round was:
| Score | Frequency |
| 10 | 0 |
| 9 | 1 |
| 8 | 0 |
| 7 | 1 |
| 6 | 3 |
| 5 | 1 |
| 4 | 4 |
| 3 | 5 |
| 2 | 3 |
| 1 | 2 |
| 0 | 1 |
The average score on the Team Round was a 3.71. The median was a 3.
Problem difficulty on the Team Round was as follows:
| Problem | Number Solved |
Solve Percentage
|
| 1 | 18 | 85.71% |
| 2 | 16 | 76.19% |
| 3 | 4 | 19.05% |
| 4 | 9 | 42.86% |
| 5 | 12 | 57.14% |
| 6 | 6 | 28.57% |
| 7 | 5 | 23.81% |
| 8 | 7 | 33.33% |
| 9 | 1 | 4.76% |
| 10 | 0 | 0.00% |
